ESG data
Environmental
・Please refer to the notes for the scope of reporting for each data.
・Data for fiscal year 2024 marked with a ✔ has been guaranteed by a third party.
| By Scope GHG emissions *1,3 |
Unit | FY2022 | FY2023 | FY2024 | Third partyIndependent Practitioner's Assurance | Note | |
|---|---|---|---|---|---|---|---|
| Scope 1 | CO₂ | Thousand t-CO₂ | 13,521 | 13,080 | 12,279 | ✔ | |
| CH₄ | Thousand t-CO₂ | 262 | 281 | 67 | ✔ | ||
| HFC | Thousand t-CO₂ | 0.3 | 0.3 | 0.3 | ✔ | ||
| N₂O | Thousand t-CO₂ | 117 | 125 | 99 | ✔ | ||
| SF₆ | Thousand t-CO₂ | 0.1 | 0.1 | 0.1 | ✔ | ||
| Total | Thousand t-CO₂ | 13,900 | 13,487 | 12,445 | ✔ | Total 7 GHGs (no use of PFCs, NF3) converted to carbon dioxide | |
| Scope 2 | Thousand t-CO₂ | 559 | 473 | 541 | ✔ | ||
| Scope3 (Category11) | Thousand t-CO₂ | 123,578 | 117,297 | 101,507 | ✔ | Use of sold products: Calculated based on coal/natural gas production and fuel/LPG production at refineries and complexes | |
| Scope 1+2 | Thousand t-CO₂ | 14,080 | 13,553 | 12,820 | ✔ | ||
| Thousand t-CO₂e | 14,459 | 13,960 | 12,986 | ✔ | Total 7 GHGs (no use of PFCs, NF3) converted to carbon dioxide | ||
| Scope 1+2+3 | Thousand t-CO₂ | 137,658 | 130,850 | 114,326 | ✔ | Scope3 records category11 (only Independent Practitioner’s Assurance coverage) |
|
| Thousand t-CO₂e | 138,038 | 131,257 | 114,493 | ✔ | Total 7 GHGs (no use of PFCs, NF3) converted to carbon dioxide | ||
|
|
|
|
|
|---|---|---|---|
|
|
|
|
|
|
|
|
|
|
|
Warranty Independent Practitioner's Assurance |
|
|---|---|---|---|---|---|---|
|
|
|
|
|
|
|
|
|
|
|
|
|
|
Warranty Independent Practitioner's Assurance |
|
|---|---|---|---|---|---|---|
|
|
|
|
|
|
|
|
-
The calculation of CO₂ emissions and reduction rates (2013, 2022-2024) includes Seibu Oil Co. Meanwhile, the calculation of GHG emissions by Scope covers consolidated refineries, etc. as of the reporting year, so the calculation period for Seibu Oil Co. includes the period from June 2022 onwards, after it became a consolidated company.
|
Reduction rate trends *1 |
|
|
|
Warranty Coverage Independent Practitioner's Assurance |
|
|---|---|---|---|---|---|
|
reduction rate |
|
|
|
|
|
| Scope 3 emissions (Idemitsu Kosan only) | Unit | FY2022 | FY2023 | FY2024 | Third partyIndependent Practitioner's Assurance | Note | |
|---|---|---|---|---|---|---|---|
| Scope3 * | Category 1: Purchased products and services *2 | Thousand t-CO₂ | 15,732 | 15,504 | 14,718 | ✔ | |
| Category3: Fuel- and energy-related activities (not included in Scope1 or 2)*1 | Thousand t-CO₂ | 4,207 | 2,918 | 2,378 | ✔ | ||
| Category4: Upstream transportation and distribution | Thousand t-CO₂ | 2,648 | 2,509 | 2,457 | ✔ | Including those included in Scope 1 emissions | |
| Category11: Use of sold products*1 | Thousand t-CO₂ | 127,853 | 123,241 | 115,985 | ✔ | Use of sold products: Calculated based on the volume of coal, natural gas, fuel and LPG, etc. sold by Idemitsu Kosan Co.,Ltd. | |
| Category12: End-of-life treatment of sold products*1 | Thousand t-CO₂ | 5,791 | 5,843 | 5,355 | ✔ | ||
-
Calculated using National Institute of Advanced Industrial Science and Technology IDEA Ver.3.2 and 3.3
|
|
|
|
|
|
Warranty Independent Practitioner's Assurance |
|
|---|---|---|---|---|---|---|
|
|
|
|
|
|
|
|
|
|
|
|
|
|
|
|
|
|
|
|
|
|
|
|
|
|
|
|
|
|
|
|
|
|
|
|
|
|
Warranty Independent Practitioner's Assurance |
|
|---|---|---|---|---|---|---|
|
|
|
|
|
|
|
|
|
|
|
|
|
|
|
|
|
(Refinery) *5 |
|
|
|
|
|
|
|
(Petrochemical factory) *6 |
|
|
|
|
|
|
|
|
|
|
|
|
Warranty Independent Practitioner's Assurance |
|
|---|---|---|---|---|---|---|
|
|
|
|
|
|
|
|
|
|
|
|
|
|
|
|
|
|
|
|
|
|
|
|
|
|
|
|
|
|
|
|
|
|
|
|
|
|
|
|
|
|
|
|
|
|
|
|
|
|
|
|
|
|
|
|
|
|
|
|
|
|
|
|
|
|
|
|
|
|
|
((1) Industrial water intake: 94,030,000 tons (2) Industrial water usage: 1,404,288,000 tons (3) Industrial water recycling: 1,310,258,000 tons, Water recycling rate = (3)/(2), *(2) = (1) + (3)) |
|
|
|
|
|
|
Warranty Independent Practitioner's Assurance |
|
|---|---|---|---|---|---|---|
|
|
|
|
|
|
|
|
|
|
|
|
|
|
|
|
|
|
|
|
|
|
|
|
|
|
|
|
|
|
|
|
| Water Pollution Effects | Unit | FY2022 | FY2023 | FY2024 | Third partyIndependent Practitioner's Assurance | Note |
|---|---|---|---|---|---|---|
| COD *7 | t | 206 | 198 | 174 | ✔ | Laws: Water Pollution Control Law |
| Total nitrogen *8 | t | 251 | 222 | 224 | ✔ | |
| Total phosphorus *8 | t | 4.2 | 3.9 | 5.1 | ✔ |
| Air pollutant emissions *10 | Unit | FY2022 | FY2023 | FY2024 | Third partyIndependent Practitioner's Assurance | Note |
|---|---|---|---|---|---|---|
| SOx | t | 10,660 | 10,047 | 8,287 | ✔ | Laws: Air Pollution Control Act |
| NOx | t | 19,981 | 21,822 | 20,451 | ✔ | |
| Soot/dust | t | 257 | 240 | 215 | ✔ | |
| VOC | t | 7,235 | 6,474 | 5,904 | ✔ |
| Waste *9 | Unit | FY2022 | FY2023 | FY2024 | Third partyIndependent Practitioner's Assurance | Note |
|---|---|---|---|---|---|---|
| Total waste | t | 225,375 | 242,238 | 218,202 | ✔ | Total amount of industrial waste and specially controlled industrial waste Laws: Waste Management and Public Cleansing Law |
| Reduced by intermediate treatment | t | 82,554 | 85,399 | 77,270 | ✔ | |
| Recycled | t | 106,908 | 115,369 | 101,714 | ✔ | |
| Final disposal | t | 25 | 1,915 | 1,125 | ✔ | |
| Final disposal rate | % | 0.011 | 0.791 | 0.52 | ✔ |
| Hazardous waste *9 | Unit | FY2022 | FY2023 | FY2024 | Third partyIndependent Practitioner's Assurance | Note |
|---|---|---|---|---|---|---|
| Total waste | t | 6,970 | 14,274 | 16,420 | Specially controlled industrial waste is defined as hazardous waste Related laws and regulations: Waste treatment and cleaning laws |
|
| Reduced by intermediate treatment | t | 1,693 | 2,409 | 628 | ||
| Recycled | t | 5,277 | 10,032 | 15,135 | ||
| Final disposal | t | 0 | 1,833 | 657 | ||
| Final disposal rate | % | 0.00 | 12.84 | 4.00 |
| Non-hazardous waste *9 | Unit | FY2022 | FY2023 | FY2024 | Third partyIndependent Practitioner's Assurance | Note |
|---|---|---|---|---|---|---|
| Total waste | t | 218,405 | 227,964 | 201,781 | Defining industrial waste as non-hazardous waste Related laws and regulations: Waste treatment and cleaning laws |
|
| Reduced by intermediate treatment | t | 80,861 | 82,990 | 76,642 | ||
| Recycled | t | 101,632 | 105,337 | 86,579 | ||
| Final disposal | t | 25 | 82 | 468 | ||
| Final disposal rate | % | 0.011 | 0.036 | 0.23 |
| Amount of fluorocarbon leaked *10 | Unit | FY2022 | FY2023 | FY2024 | Third partyIndependent Practitioner's Assurance | Note |
|---|---|---|---|---|---|---|
| t-CO2e | 586 | 2,057 | 352 | Fidures based on Fluorocarbon calculation report of Law Concerningthe Discharge and Control of Fluorocarbons |
-
Hokkaido Refinery, Chiba Complex, Aichi Complex, Tokuyama Complex, Lubricants Research Laboratory, Advanced Technology Research Laboratories, Performance Materials Laboratories, Narita hydrogen station, Hakodate oil terminal, Niigata Petroleum Import Terminal
|
|
|
|
|
|
Warranty Independent Practitioner's Assurance |
|
|---|---|---|---|---|---|---|
|
|
|
|
|
|
|
|
| ISO14001(環境 マネジメントシステム) 取得状況Acquisition Status of ISO 14001 (Environmental Management Systems) |
Unit | As of June 30, 2023 |
As of June 30, 2024 |
2025 As of June 30th |
Third partyIndependent Practitioner's Assurance | Note |
|---|---|---|---|---|---|---|
| Domestic business sites | Number of certifications | 17 | 29 | 13 | From the perspective of environmental management, it covers more than 95% of CO2 emissions. | |
| Overseas business sites | Number of certifications | 13 | 14 |
-
Idemitsu Kosan, consolidated refining companies (Toa and Yokkaichi) and major consolidated companies
-
Past fiscal year data corrections have been reflected.
-
Idemitsu Gas Production (Vietnam) Co.,Ltd.
-
Muswellbrook Coal Co., Ltd., Boggabri Coal Pty. Ltd.
-
Hokkaido Refinery, Chiba Complex (oil), Aichi Complex TOA Oil Co., Showa Yokkaichi Sekiyu Co.
-
Chiba Complex (Chemicals), Tokuyama Complex
-
Hokkaido Refinery, Chiba Complex, Aichi Complex, Tokuyama Complex, TOA Oil Co., Showa Yokkaichi Sekiyu Co. and major consolidated companies
-
Chiba Complex, Aichi Complex, Tokuyama Complex, TOA Oil Co., Showa Yokkaichi Sekiyu Co. and major consolidated companies
-
Hokkaido Refinery, Chiba Complex, Aichi Aichi Complex, Tokuyama Complex, TOA Oil Co., Showa Yokkaichi Sekiyu Co.
-
Idemitsu Kosan
-
Idemitsu Kosan and major affiliated companies
Refineries/Complexes
Refineries/Complexes
| Hokkaido Refinery | Unit | FY2022 | FY2023 | FY2024 |
|---|---|---|---|---|
| Crude oil throughput | Thousand kL | 5,973 | 6,956 | 5,038 |
| Energy consumption (crude oil equivalent) | Thousand kL *1 | 456 | 509 | 397 |
| Unit energy consumption | kL/Thousand kL *2 | 8.83 | 8.80 | 9.16 |
| Seawater | Thousand tons | 135,851 | 149,238 | 107,337 |
| Industrial water | Thousand tons | 13,105 | 13,022 | 13,752 |
| Tap water | Thousand tons | 65 | 66 | 83 |
| Underground water | Thousand tons | 238 | 73 | 0 |
| CO2 emissions | Thousand t-CO₂ | 1,392 | 1,518 | 1,183 |
| SOx emissions | t | 1,580 | 1,555 | 1,549 |
| NOx emissions | t | 1,061 | 1,180 | 931 |
| Soot/dust | t | 3 | 2 | 8 |
| Wastewater | Thousand kL | 148,994 | 162,399 | 121,171 |
| COD | t | 18 | 18 | 19 |
| Total nitrogen | t | - | - | - |
| Total phosphorus | t | - | - | - |
| Total waste | t | 5,911 | 6,691 | 6,217 |
| Reduced by intermediate treatment | t | 1,387 | 1,717 | 1,583 |
| Recycled | t | 3,837 | 3,833 | 3,425 |
| Final disposal | t | 2 | 2 | 1 |
-
The figure for energy consumption (crude oil equivalent) is calculated by subtracting the amount of by-product energy sold.
-
Unit energy consumption = Crude oil equivalent (L) / Atmospheric distillation equipment converted throughput (kL)
| Chiba Complex | Unit | FY2022 | FY2023 | FY2024 |
|---|---|---|---|---|
| Crude oil throughput | Thousand kL | 10,660 | 9,083 | 10,242 |
| Petrochemical product manufacturing (Ethylene equivalent) | Thousand tons | 1,874 | 1,423 | 1,639 |
| Energy consumption (crude oil equivalent) | Thousand kL *1 | 1,473 | 1,247 | 1,346 |
| Unit energy consumption | kL/Thousand kL *2 | 8.83 | 9.18 | 9.41 |
| kL/t *3 | 0.32 | 0.35 | 0.34 | |
| Seawater | Thousand tons | 456,730 | 396,939 | 461,436 |
| Industrial water | Thousand tons | 19,889 | 19,136 | 20,198 |
| Tap water | Thousand tons | - | - | - |
| Underground water | Thousand tons | 343 | 329 | 337 |
| CO2 emissions | Thousand t-CO₂ | 3,563 | 3,069 | 3,272 |
| SOx emissions | t | 3,672 | 2,715 | 2,704 |
| NOx emissions | t | 2,524 | 2,128 | 2,391 |
| Soot/dust | t | 122 | 88 | 75 |
| Wastewater | Thousand kL | 475,913 | 415,335 | 480,893 |
| COD | t | 38 | 35 | 34 |
| Total nitrogen | t | 65 | 65 | 78 |
| Total phosphorus | t | 0.3 | 0.3 | 0.3 |
| Total waste | t | 77,105 | 84,807 | 66,721 |
| Reduced by intermediate treatment | t | 1,720 | 4,729 | 3,276 |
| Recycled | t | 41,864 | 43,431 | 28,378 |
| Final disposal | t | 5 | 6 | 5 |
-
The figure for energy consumption (crude oil equivalent) is calculated by subtracting the amount of by-product energy sold.
-
Unit energy consumption = Crude oil equivalent (L) / Atmospheric distillation equipment converted throughput (kL)
-
Unit energy consumption = Crude oil equivalent (L) / Ethylene equivalent production (t)
| Aichi Complex | Unit | FY2022 | FY2023 | FY2024 |
|---|---|---|---|---|
| Crude oil throughput | Thousand kL | 7,879 | 7,362 | 7,917 |
| Energy consumption (crude oil equivalent) | Thousand kL *1 | 702 | 744 | 770 |
| Unit energy consumption | kL/Thousand kL *2 | 9.56 | 9.94 | 9.14 |
| Seawater | Thousand tons | 237,441 | 242,017 | 243,279 |
| Industrial water | Thousand tons | 13,629 | 15,462 | 15,895 |
| Tap water | Thousand tons | 165 | 174 | 178 |
| Underground water | Thousand tons | - | - | - |
| CO2 emissions | Thousand t-CO₂ | 1,910 | 2,040 | 2,153 |
| SOx emissions | t | 736 | 940 | 825 |
| NOx emissions | t | 1,362 | 1,445 | 1,451 |
| Soot/dust | t | 50 | 49 | 56 |
| Wastewater | Thousand kL | 251,235 | 257,652 | 259,352 |
| COD | t | 10 | 16 | 16 |
| Total nitrogen | t | 10 | 18 | 27 |
| Total phosphorus | t | 1.2 | 1.0 | 1.0 |
| Total waste | t | 68,666 | 66,869 | 80,244 |
| Reduced by intermediate treatment | t | 45,396 | 43,249 | 49,646 |
| Recycled | t | 21,988 | 22,036 | 28,972 |
| Final disposal | t | 17 | 65 | 173 |
-
The figure for energy consumption (crude oil equivalent) is calculated by subtracting the amount of by-product energy sold.
-
Unit energy consumption = Crude oil equivalent (L) / Atmospheric distillation equipment converted throughput (kL)
| Tokuyama Complex | Unit | FY2022 | FY2023 | FY2024 |
|---|---|---|---|---|
| Petrochemical product manufacturing (Ethylene equivalent) | Thousand tons | 1,523 | 1,714 | 1,115 |
| Energy consumption (crude oil equivalent) | Thousand kL *1 | 861 | 941 | 674 |
| Unit energy consumption | kL/t *2 | 0.57 | 0.55 | 0.62 |
| Seawater | Thousand tons | 396,776 | 424,998 | 348,422 |
| Industrial water | Thousand tons | 10,159 | 5,698 | 11,220 |
| Tap water | Thousand tons | 202 | 195 | 214 |
| Underground water | Thousand tons | - | - | - |
| CO2 emissions | Thousand t-CO₂ | 1,792 | 1,924 | 1,469 |
| SOx emissions | t | 812 | 829 | 761 |
| NOx emissions | t | 1,492 | 1,691 | 1,255 |
| Soot/dust | t | 14 | 17 | 16 |
| Wastewater | Thousand kL | 406,139 | 430,888 | 359,853 |
| COD | t | 16 | 16 | 16 |
| Total nitrogen | t | 14 | 16 | 17 |
| Total phosphorus | t | 0.5 | 0.7 | 0.7 |
| Total waste | t | 28,405 | 37,535 | 29,327 |
| Reduced by intermediate treatment | t | 17,782 | 18,478 | 12,767 |
| Recycled | t | 10,623 | 17,224 | 16,054 |
| Final disposal | t | 0 | 1,833 | 507 |
-
The figure for energy consumption (crude oil equivalent) is calculated by subtracting the amount of by-product energy sold.
-
Unit energy consumption = Crude oil equivalent (L) / Ethylene equivalent production (t)
Emissions and transfers of PRTR-regulated substances (FY2024)
| PRTR-No. |
CAS No. |
Substance name | Unit | 合計 / 排出量- 大気への排出 (標準単位) Total / Discharged amount – Emissions to atmosphere (standard emission intensity) |
合計 / 排出量- 公共用水域への排出 (標準単位) Total/Discharged amount – Emissions to public water bodies (standard emission intensity) |
合計 / 排出量- 土壌への排出 (標準単位) Total/Discharged amount – Emissions to soil (standard emission intensity) |
合計 / 移動量- 廃棄物 (標準単位) Total/Transferred amount – Disposed amount (standard emission intensity) |
Total |
|---|---|---|---|---|---|---|---|---|
| 1 | - | Water-soluble compounds of zinc | t | 0.0 | 1.4 | 0.0 | 0.0 | 1.4 |
| 20 | 141-43-5 | 2-aminoethanol | t | 0.0 | 0.0 | 0.0 | 52.1 | 51.2 |
| 33 | 1332-21-4 | Asbestos | t | 0.0 | 0.0 | 0.0 | 4.4 | 4.4 |
| 36 | 78-79-5 | Isoprene | t | 0.1 | 0.0 | 0.0 | 0.0 | 0.1 |
| 53 | 100-41-4 | Ethylbenzene | t | 10.5 | 0.0 | 0.0 | 0.8 | 11.3 |
| 80 | 1330-20-7 | Xylene (also known as dimethylbenzene) |
t | 24.1 | 0.0 | 0.0 | 1.5 | 25.6 |
| 186 | 75-09-2 | Dichloromethane (also known as methylene chloride) |
t | 0.2 | 0.0 | 0.0 | 14.8 | 15.0 |
| 190 | 77-73-6 | Dicyclopentadiene | t | 0.2 | 0.0 | 0.0 | 0.0 | 0.2 |
| 232 | 68-12-2 | N,N-dimethylformamide | t | 0.0 | 0.0 | 0.0 | 29.9 | 29.9 |
| 240 | 100-42-5 | Styrene | t | 17.2 | 0.0 | 0.0 | 1.1 | 18.3 |
| 243 | - | Dioxins | mg-TEQ | 0.0 | 9.1 | 0.0 | 0.0 | 9.1 |
| 260 | 1897-45-6 | 2,4,5,6-tetrachloroisophthalonitrile (also known as chlorothalonil or TPN) |
t | 0.0 | 0.0 | 0.0 | 26.0 | 26.0 |
| 262 | 127-18-4 | Tetrachlorethylene | t | 0.0 | 0.0 | 0.0 | 1.0 | 1.0 |
| 300 | 108-88-3 | Toluene (also known as methylbenzene) |
t | 96.3 | 0.0 | 0.0 | 17.8 | 114.1 |
| 302 | 91-20-3 | Naphthalene | t | 0.1 | 0.0 | 0.0 | 1.7 | 1.8 |
| 309 | 7440-02-0 | Nickel compounds | t | 0.0 | 0.0 | 0.0 | 0.6 | 0.6 |
| 333 | 302-01-2 | hydrazine | t | 0.0 | 0.0 | 0.0 | 1.9 | 1.9 |
| 349 | 108-95-2 | Phenol | t | 0.1 | 0.0 | 0.0 | 4.6 | 4.7 |
| 389 | 112-02-7 | Hexadecyltrimethylammonium chloride | t | 0.0 | 11.2 | 0.0 | 0.0 | 11.2 |
| 392 | 110-54-3 | N-hexane | t | 226.7 | 0.0 | 0.0 | 8.9 | 235.5 |
| 400 | 71-43-2 | Benzene | t | 24.7 | 0.0 | 0.0 | 0.0 | 24.7 |
| 412 | - | Manganese and its compounds | t | 0.0 | 0.0 | 0.0 | 9.2 | 9.2 |
| 629 | 110-82-7 | Cyclohexane | t | 5.1 | 0.0 | 0.0 | 35.5 | 40.6 |
| 661 | 110-71-4 | 1,2-Dimethoxyethane | t | 0.0 | 0.0 | 0.0 | 0.9 | 0.9 |
| 674 | - | Tetrahydrofuran | t | 0.0 | 0.0 | 0.0 | 2.2 | 2.2 |
| 691 | - | Trimethylbenzene t | t | 3.9 | 0.0 | 0.0 | 0.0 | 3.9 |
| 731 | 142-82-5 | Heptane | t | 15.6 | 0.0 | 0.0 | 2.3 | 17.8 |
-
Scope of Reporting: Idemitsu, consolidated refining companies (TOA Oil Co., Ltd., Showa Yokkaichi Sekiyu Co., Ltd., Seibu Oil Co.,Ltd.) and major consolidated group companies
-
Chemicals are not listed if the total volume of discharge and transfer is less than 0.1 ton per year.
-
Figures presented above may not be consistent with the totals since they are rounded off to one decimal place.
-
PRTR: Act on the Assessment of Releases of Specified Chemical Substances in the Environment and the Promotion of Management Improvement
Society
・The scope of data collection is Idemitsu Kosan itself. The scope of reporting differs for some data, so please refer to the notes section of each data for details.
・Data for fiscal year 2024 marked with a ✔ has been guaranteed by a third party.
| Employment status *As of March 31, 2025 |
Unit | FY2022 | FY2023 | FY2024 | Third partyIndependent Practitioner's Assurance | Note | ||
|---|---|---|---|---|---|---|---|---|
| Number of employees (combined number of members and employees in managerial positions) | People | 4,981 | 4,960 | 5,060 | ✔ | [Target of data] Employee, Senior (Full-time), Seconded However, this does not include employees seconded to other companies. |
||
| Men | People | 4,316 | 4,256 | 4,372 | ✔ | |||
| Women | People | 665 | 704 | 688 | ✔ | |||
| Percentage of women | % | 13.4 | 14.2 | 13.6 | ✔ | |||
| Foreign nationality | People | 36 | 29 | 28 | ||||
| Percentage of foreign nationals | % | 0.7 | 0.6 | 0.6 | ||||
| Senior (over 60 years old) |
People | 433 | 595 | 407 | ||||
| Senior (Over 65 years old) |
People | 160 | 144 | 127 | ||||
| Number of members | People | 4,029 | 3,777 | 4,735 | [Target of data] Includes full-time employees, seniors (full-time), seconded employees, and employees seconded to other companies |
|||
| Men | People | 3,397 | 3,177 | 4,026 | ||||
| Women | People | 632 | 600 | 709 | ||||
| Percentage of women | % | 15.7 | 15.9 | 15.0 | ||||
| Number of employees in managerial positions (managers, general managers) |
People | 952 | 924 | 1,413 | ✔ | |||
| Men | People | 919 | 883 | 1,349 | ✔ | |||
| Women | People | 33 | 41 | 64 | ✔ | |||
| Percentage of women | % | 3.5 | 4.4 | 4.6 | ✔ | |||
| Of the numbers of employees in managerial positions, higher posts than general manager | People | 44 | 48 | 78 | ||||
| Men | People | 41 | 43 | 73 | ||||
| Women | People | 3 | 5 | 5 | ||||
| Percentage of women | % | 6.8 | 10.4 | 6.4 | ||||
| Of the numbers of employees in managerial positions, lower posts than deputy general manager | People | 908 | 876 | 1,335 | ||||
| Men | People | 878 | 840 | 1,276 | ||||
| Women | People | 30 | 36 | 59 | ||||
| Percentage of women | % | 3.3 | 4.1 | 4.4 | ||||
| Average age | age | 42.2 | 41.6 | 42.0 | ✔ | [Target of data] Employee, Senior (Full-time), Seconded However, this does not include employees seconded to other companies. |
||
| Men | age | 42.5 | 41.8 | 42.3 | ✔ | |||
| Women | age | 40.5 | 40.7 | 40.4 | ✔ | |||
| Average years employed | Year | 18.5 | 18.0 | 17.8 | ✔ | |||
| Men | Year | 18.9 | 18.3 | 18.2 | ✔ | |||
| Women | Year | 16.1 | 16.6 | 15.5 | ✔ | |||
| Average wage |
Basic wages received by men | Management-level employees | yen/month | 688,951 | 693,770 | 707,400 | [Target of data] Idemitsu Kosan Co., Ltd. Employment (Employee, Senior, Full-time Contract, Advisor) Includes employees seconded to other companies |
|
| Staff members | yen/month | 342,687 | 354,626 | 377,902 | ||||
| Bonuses received by men | Management-level employees | yen/year | 5,201,780 | 5,387,778 | 5,240,938 | |||
| Staff members | yen/year | 2,401,878 | 2,592,877 | 2,437,126 | ||||
| Basic wages received by women | Management-level employees | yen/month | 664,407 | 664,054 | 662,988 | |||
| Staff members | yen/month | 319,638 | 331,811 | 354,872 | ||||
| Bonuses received by women | Management-level employees | yen/year | 4,699,277 | 4,738,437 | 4,625,117 | |||
| Staff members | yen/year | 1,995,833 | 2,194,812 | 2,049,628 | ||||
| Average salary (The average of the total monthly salary and bonus) | yen/year | - | 9,800,598 | 9,936,913 | [Target of data] Employed by Idemitsu Kosan Co., Ltd. (Employees, Senior Full-time, Advisors) However, excluding those seconded to other companies and those seconded to other companies |
|||
| Average gender salary gap | % | - | 73.4 | 76.5 | Average gender salary gap: The difference between the average salary of male full-pay relevant employees and female full-pay relevant employees. *The gender gap in salary is not considered to stem from the remuneration structures or systems, but rather from factors such as disparities in the grade system. There is no disparity in the remuneration system based on gender, gender identity, or other personal attributes. The observed salary differences are due to variations in the composition of employees by grade. We will work towards ensuring diversity at management levels that is not influenced by characteristics such as gender. |
|||
| Status of employees with disabilities *As of June 1, 2024 |
Percentage | % | 2.50 | 2.55 | 2.57 | ✔ | [Scope of Reporting] Scope of Reporting: Idemitsu hires (employees, seniors, full-time contract employees, and advisors) Including employees seconded to other companies, but excluding employees seconded from other companies Based on the calculation method of the Ministry of Health, Labour and Welfare |
|
| Number | People | 125 | 127 | 135 | ||||
| Number of employees (Consolidated) | People | 14,363 | 13,991 | 13,814 | [Target of calculation] Idemitsu Kosan and consolidated subsidiaries (63 companies in FY2022, 56 companies in FY2023, 58 companies in FY2024) |
|||
| Turnover rate (Including honorable retreat) | % | 4.22 | 4.50 | 3.13 | [Scope of Reporting] Idemitsu hires (employees, seniors, full-time contract employees, and advisors) Excluding employees seconded to other companies |
|||
| Voluntary retirement rate | % | 2.29 | 2.22 | 1.74 | ||||
| New employee retention rate (Average for those joining the company between 2020 and 2022) |
% | 89.3 | 88.6 | 90.4 | ✔ | [Scope of Reporting] Results are from Idemitsu's direct hires Retention rate: Average rate of three-year retention of new graduates in the relevant fiscal years Turnover rate: Average rate of new graduates within three years of employment in the relevant fiscal year |
||
| New employee turnover rate (Average for new recruits in 2022) |
% | 10.0 | 10.6 | 4.7 | ✔ | |||
| Status of Recruitment | Unit | FY2022 | FY2023 | FY2024 | Third partyIndependent Practitioner's Assurance | Note | |
|---|---|---|---|---|---|---|---|
| Number of new graduates hired *Recruited in April 2025 |
People | 87 | 101 | 130 | ✔ | [Target of data] Idemitsu Kosan's direct employment record. Data in parentheses for fiscal years 2022, 2023, and 2024 are for graduates and above. |
|
| (48) | (63) | (74) | ✔ | ||||
| Men | People | 70 | 72 | 91 | ✔ | ||
| (32) | (38) | (39) | ✔ | ||||
| Women | People | 17 | 29 | 39 | ✔ | ||
| (16) | (25) | (35) | ✔ | ||||
| Percentage of women | % | 19.5 | 28.7 | 30.0 | ✔ | ||
| (33.3) | (39.7) | (47.3) | ✔ | ||||
| Foreign nationality | People | 1 | 0 | 0 | ✔ | ||
| (1) | (0) | (0) | ✔ | ||||
| Percentage of foreign nationals | % | 1.1 | 0 | 0.0 | ✔ | ||
| (2.1) | (0.0) | (0.0) | ✔ | ||||
| Career recruitment *Hired in FY2023 |
People | 33 | 51 | 81 | ✔ | [Scope of Reporting] Idemitsu Kosan's direct employment records for hires made between April 1 and March 31 |
|
| Women | People | - | 28 | 25 | |||
| Percentage of women | % | - | 54.9 | 30.9 | |||
| Female hiring ratio | Percentage of women | % | 39.5 | 47.3 | 38.7 | ✔ | [Scope of Reporting] Results are from Idemitsu’s direct hires college graduates or higher (Recruitment of new graduates, and Career) between April 1 and March 31. |
| Work-Life Balance Support Systems and Usage Numbers | Unit | FY2022 | FY2023 | FY2024 | Third partyIndependent Practitioner's Assurance | Note | |
|---|---|---|---|---|---|---|---|
| Maternity leave | Women | People | 31 | 26 | 27 | ✔ | [Target of data] Idemitsu Kosan Employment (including employees and those seconded to other companies) |
| Childcare leave | People | 168 | 198 | 184 | ✔ | ||
| Men | People | 142 | 176 | 159 | ✔ | ||
| Women | People | 26 | 22 | 25 | ✔ | ||
| Rate of employees taking childcare leave* | % | 86 | 94 | 93 | ✔ | [Target of data] Idemitsu Kosan Employment (all employees, including those seconded to other companies) Results as of March 31st *The above includes childcare leave. |
|
| Men | % | 84 | 93 | 92 | ✔ | ||
| Women | % | 96 | 110 | 104 | ✔ | ||
| Rate of employees returning to work after childcare leave | % | 100 | 100 | 100 | ✔ | [Target of data] Idemitsu Kosan Employment (including employees and those seconded to other companies) |
|
| Men | % | 100 | 100 | 100 | ✔ | ||
| Women | % | 100 | 100 | 100 | ✔ | ||
| Nursing care leave | People | 8 | 7 | 7 | ✔ | ||
| Men | People | 7 | 4 | 5 | ✔ | ||
| Women | People | 1 | 3 | 2 | ✔ | ||
| Reduced working hours for parenting | People | 50 | 61 | 69 | ✔ | ||
| Men | People | 3 | 4 | 2 | ✔ | ||
| Women | People | 47 | 57 | 67 | ✔ | ||
| Leave to care for sick/injured child | People | 228 | 257 | 258 | ✔ | ||
| Men | People | 121 | 137 | 142 | ✔ | ||
| Women | People | 107 | 120 | 116 | ✔ | ||
| Family care leave | People | 56 | 84 | 96 | ✔ | ||
| Men | People | 44 | 69 | 74 | ✔ | ||
| Women | People | 12 | 15 | 22 | ✔ | ||
| Telecommuting | People | 4,592 | 4,213 | 4,577 | ✔ | ||
| Men | People | 4,033 | 3,585 | 3,898 | ✔ | ||
| Women | People | 559 | 628 | 679 | ✔ | ||
| Self-development leave of absence | People | 3 | 4 | 6 | ✔ | ||
| Men | People | 1 | 2 | 2 | ✔ | ||
| Women | People | 2 | 2 | 4 | ✔ | ||
| Volunteer leave of absence | People | 0 | 0 | 0 | |||
| Men | People | 0 | 0 | 0 | |||
| Women | People | 0 | 0 | 0 | |||
| Cessation from work by employees whose spouses are transferred to countries abroad | People | 8 | 10 | 4 | |||
| Men | People | 0 | 0 | 1 | |||
| Women | People | 8 | 10 | 3 | |||
|
時間外勤務、 年次有給休暇取得実績 Overtime Work and Annual Paid Leave |
Unit | FY2022 | FY2023 | FY2024 | Third partyIndependent Practitioner's Assurance | Note |
|---|---|---|---|---|---|---|
| Average overtime work hours per employee | hours/month | 20.5 | 20.1 | 21.5 | ✔ | [Target of data] Idemitsu Kosan Employment (Employees) However, this does not include employees on leave or on secondment. Overtime work is not available to managers. |
| Average annual paid leave taken by an employee | Days | 16.9 | 17.5 | 17.2 | ✔ | |
| Average usage rate of annual paid leave per employee | % | 83.0 | 85.4 | 84.6 | ✔ |
| Training Results | Unit | FY2022 | FY2023 | FY2024 | Third partyIndependent Practitioner's Assurance | Note | |
|---|---|---|---|---|---|---|---|
| Training hours | Total | hours | 74,722 | 68,252 | 92,304 | ✔ | [Target of calculation] Education and training hosted by Idemitsu Kosan alone, the Human Resources Department, and Career Design Department |
| Per person | hours | 12.8 | 11.8 | 15.8 | ✔ | ||
| Amount of investment in training | Total | Thousand yen | 247,810 | 299,138 | 318,488 | ✔ | |
| Per person | Thousand yen | 43 | 52 | 55 | ✔ | ||
| Occupational Safety Performance | Unit | 2022 | 2023 | 2024 | Third partyIndependent Practitioner's Assurance | Note | ||
|---|---|---|---|---|---|---|---|---|
| fatal accident | number | Cases | 0 | 0 | 1 | Hokkaido Refinery, Chiba Complex (including Prime Polymer Co., Ltd.'s Anesaki Plant), Aichi Complex, Tokuyama Complex, TOA Oil Co., Showa Yokkaichi Sekiyu Co., Seibu Oil Co. ■ Employees: Employees of Idemitsu Kosan Co., Ltd., TOA Oil Co., Showa Yokkaichi Sekiyu Co., Seibu Oil Co., and Prime Polymer Co., Ltd. who work at the bases covered by the above calculations. ■ Employees of partner companies: Employees of Idemitsu Plantech Hokkaido Co., Ltd., Idemitsu Plantech Chiba Co., Ltd., Idemitsu Plantech Aichi Co., Ltd., Idemitsu Plantech Tokuyama Co., Ltd., and employees of partner companies to which the above-mentioned bases subject to the data collection outsource their work. [Data collection period] January to December [Calculation method] Frequency rate = (number of accidents resulting in time off work / total number of actual working hours) x 1,000,000 Severity rate = (total number of work days lost / total number of actual working hours) x 1,000 Total frequency rate = ((Number of accidents resulting in lost workdays + Number of accidents not resulting in lost workdays) / Total actual working hours) x 1,000,000 *Starting this time, the calculation method for frequency rate and total frequency rate has been changed from the number of accidents to the number of victims. [Reason] To more appropriately reflect the actual situation of accidents involving multiple victims. |
||
| Number | Employee | People | 0 | 0 | 0 | ✔ | ||
| Employees of partner companies | People | 0 | 0 | 1 | ✔ | |||
| Lost-time injuries (including fatal injuries) | number | Cases | 6 | 16 | 23 | |||
| Number | Employee | People | 1 | 4 | 7 | |||
| Employees of partner companies | People | 5 | 12 | 21 | ||||
| Accidents not resulting in lost work time | number | Cases | 34 | 29 | 44 | |||
| Number | Employee | People | 10 | 5 | 17 | |||
| Employees of partner companies | People | 24 | 24 | 27 | ||||
| Frequency rate | Employee | - | 0.15 | 0.60 | 1.12 | ✔ | ||
| Employees of partner companies | - | 0.46 | 0.98 | 1.59 | ✔ | |||
| Severity rate | Employee | - | 0.00 | 0.01 | 0.03 | ✔ | ||
| Employees of partner companies | - | 0.02 | 0.04 | 0.52 | ✔ | |||
| Total frequency rate | Employee | - | 1.62 | 1.35 | 3.84 | ✔ | ||
| Employees of partner companies | - | 2.66 | 2.72 | 3.64 | ✔ | |||
| Process Safety Accident Results | Unit | 2022 | 2023 | 2024 | Third partyIndependent Practitioner's Assurance | Note | |
|---|---|---|---|---|---|---|---|
| Serious Process Accident | Cases | 0 | 0 | 0 | ✔ | [Target of data] Hokkaido Refinery, Chiba Complex (including Prime Polymer Co., Ltd.'s Anesaki Plant), Aichi Complex, Tokuyama Complex, TOA Oil Co., Showa Yokkaichi Sekiyu Co., Seibu Oil Co. [Data collection period] January to December |
|
| Acquisition Status of ISO 45001 (Eoccupational Health and Safety Management Systems (OHSMS)) |
Unit | As of June 30, 2023 |
As of June 30, 2024 |
2025 As of June 30th |
third party Warranty CoverageIndependent Practitioner's Assurance |
Note | |
|---|---|---|---|---|---|---|---|
| Domestic and overseas business sites | Number of certifications | - | 10 | 10 | |||
|
ISO 9001(Quality Management Systems)Acquisition status |
|
2023 |
2024 |
As of June 30th |
Warranty Independent Practitioner's Assurance |
|
|---|---|---|---|---|---|---|
|
|
|
|
|
|
|
|
| Results Related to Health | Unit | FY2022 | FY2023 | FY2024 | Note | |
|---|---|---|---|---|---|---|
| Periodic medical checkup participation rate | % | 99.9 | 100.0 | 100.0 | [Number of employees] Idemitsu Kosan employees (including employees seconded to other companies, excluding employees seconded to other companies and employees working overseas) | |
| Ratio of employees who underwent follow-up medical checkups | % | 89.0 | 91.1 | 88.0 | [Scope of follow-up medical checkups] Including non-mandatory items | |
| Ratio of employees requiring blood pressure control measures | % | 0.1 | 0.1 | 0.2 | [Calculation criteria] Individuals whose systolic blood pressure is 180mmHg or higher or whose diastolic blood pressure is 110mmHg or higher | |
| Ratio of employees requiring diabetes control measures | % | 0.5 | 0.5 | 0.5 | [Calculation criteria] Individuals with an HbA1c level of 8.0% or higher | |
| Ratio of employees who received health guidance after being diagnosed as high risk | % | 94.6 | 97.0 | 94.1 | [Calculation criteria] Individuals considered as requiring control measures for BMI, blood pressure, ALT/HDL cholesterol, LDL cholesterol, neutral lipid or HbA1c in order to meet Idemitsu’s standards | |
| Ratio of employees who receive ongoing assistance after being diagnosed as high risk | % | 75.2 | 70.4 | 66.9 | [Number of employees] Employees employed by Idemitsu Kosan (including employees seconded to other companies, excluding employees seconded to other companies and employees working overseas) who are under the jurisdiction of the Head Office Medical Office | |
| Ratio of employees not considered as requiring weight control measures | % | 65.2 | 64.8 | 63.9 | [Calculation criteria] Individuals whose BMI ranges from 18.5 to below 25.0 | |
| The result of the medical examination questionnaire | Ratio of employees who smokes | % | 20.6 | 20.9 | 21.5 | |
| Ratio of employees who maintain exercise habits | % | 37.0 | 37.3 | 38.0 | [Calculation criteria] Individuals who engage in at least 30 minutes of physical exercise twice a week | |
| Ratio of employees with no sleeping issues inhibiting sufficient rest | % | 75.9 | 75.4 | 72.5 | ||
| Ratio of employees who maintain a regular drinking habit | % | 17.8 | 20.2 | 23.5 | [Calculation criteria] Individuals who habitually drink alcohol in a quantity equivalent to at least 360ml of rice wine on a daily basis or several days a week | |
| Ratio of employees who eat breakfast | % | 74.9 | 73.7 | 73.5 | [Calculation criteria] Individuals who eat breakfast at least five times a week | |
| Ratio of employees deemed to practice robust self healthcare | % | 28.0 | 27.8 | 26.9 | [Calculation criteria] Individuals with no lifestyle-related issues, such as smoking, a lack of exercise, poor sleeping, a regular drinking habit, or failure to eat breakfast | |
| Ratio of employees who took leave due to mental health issues | % | 1.7 | 1.6 | 2.0 | [Count parameters] Employees employed by Idemitsu Kosan (including employees seconded to other companies and employees working overseas, but excluding employees seconded from other companies) [Counting criteria] Employees who are absent for more than one consecutive month due to mental health issues, and those who are absent multiple times within a fiscal year, will be counted each time. |
|
| Employee stress checks | Participation rate | % | 88.8 | 88.0 | 89.0 | [Count parameters] Employees employed by Idemitsu Kosan (including those working overseas, excluding those seconded to or accepted from other companies) |
| Ratio of employees exposed to a high level of stress | % | 7.8 | 7.5 | 7.4 | [Scope of Reporting] Individuals who underwent stress checks [High[Criteria for a high level of stress] stress standard] Based on standards recommended by the Ministry of Health, Labour and Welfare |
|
| Presenteeism | % | 19.2 | 20.3 | 20.3 | [Calculation Criteria] A drop degree of the productivity by the aggravation of the mental and physical health condition. The standard uses the University of Tokyo (SPQ). | |
| Work Engagement | % | 2.6 | 2.6 | 2.6 | Indicators of positive work-related feelings *The higher the score, the better the condition (maximum: 4 points) Measured using two items (vitality and enthusiasm) in the New Occupational Stress Simple Questionnaire |
|
Governance
Governance
・The scope of data is Idemitsu Kosan non-consolidated.
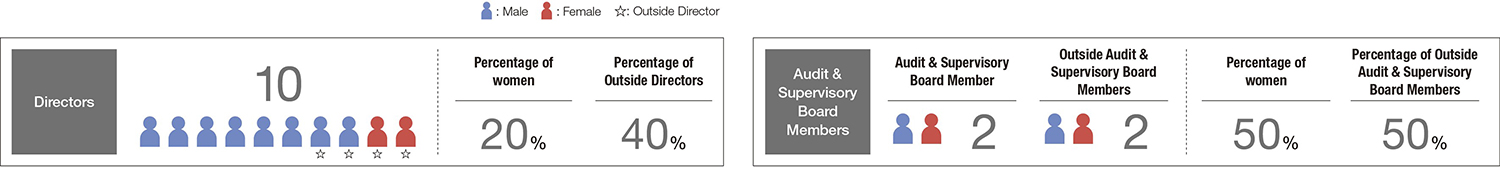
| Composition of Executive *As of June 30, 2024 |
Unit | FY2022 | FY2023 | FY2024 | FY2025 | |
|---|---|---|---|---|---|---|
| Directors | People | 11 | 11 | 10 | 10 | |
| Of the numbers mentioned above, Outside Directors | People | 4 (Female 2) |
4 (Female 2) |
4 (Female 2) |
4 (Female 2) |
|
| Audit & Supervisory Board Members | People | 4 | 4 | 4 | 4 | |
| Of the numbers mentioned above, Outside Audit & Supervisory Board Members | People | 2 | 2 | 2 | 2 | |
| Number of Convened Meetings of the Board of Directors, etc. | Unit | FY2022 | FY2023 | FY2024 | |
|---|---|---|---|---|---|
| Board of directors | Number of meetings | times | 15 | 15 | 15 |
| Average rate of attendance | % | 99.4 | 99.4 | 99.1 | |
| Audit & Supervisory Board | Number of meetings | times | 16 | 16 | 16 |
| Average rate of attendance | % | 100 | 100 | 100 | |
| Compliance | Unit | FY2022 | FY2023 | FY2024 | Note |
|---|---|---|---|---|---|
| serious compliance violation | Cases | 2 | 0 | 1 | [Scope of Reporting] Idemitsu and affiliated companies |
| Number of cases of corruption and bribery | Cases | 0 | 0 | 0 | |
| Number of employee disciplinary actions related to corruption and bribery | Cases | 0 | 0 | 0 | |
| Tax compliance violation | Cases | 0 | 0 | 0 | [Scope of Reporting] Idemitsu and affiliated companies substantially controlled by Idemitsu (Companies of which Idemitsu hold more than 50% shares except for Astomos Energy Corporation) |
| information security | Unit | FY2022 | FY2023 | FY2024 | Note |
|---|---|---|---|---|---|
| Serious information security violation | Cases | 0 | 0 | 0 | [Scope of Reporting] Idemitsu and affiliated companies |
| Serious violations of personal information | Cases | 0 | 0 | 0 |
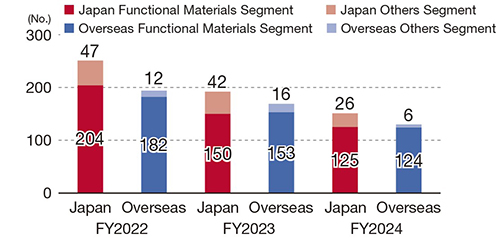
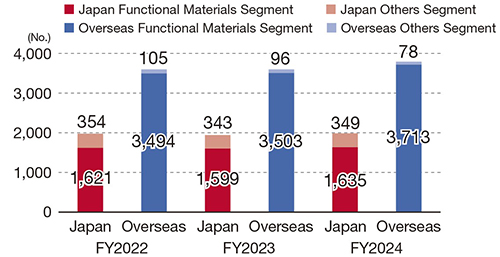
| intellectual property | Unit | FY2022 | FY2023 | FY2024 | Note | |
|---|---|---|---|---|---|---|
| Number of patents published applications | Japan | Cases | 251 | 192 | 151 | [Target of calculation] Idemitsu Kosan, Idemitsu Unitech Co., Ltd., Idemitsu Fine Composites Co., Ltd., Solar Frontier K.K., Nippon Grease Co., Ltd., Idemitsu Engineering Co., Ltd., Idemitsu Credit Co., Ltd., Idemitsu Retail Sales Co., Ltd., SDS Biotech Co., Ltd. |
| Overseas | Cases | 194 | 169 | 130 | ||
| Number of registered patents held | Japan | Cases | 1,975 | 1,942 | 1,984 | |
| Overseas | Cases | 3,599 | 3,599 | 3,791 | ||
Graph collection
Graph collection
● Resources inputs and environmental impacts of Idemitsu Group business activities in fiscal 2024
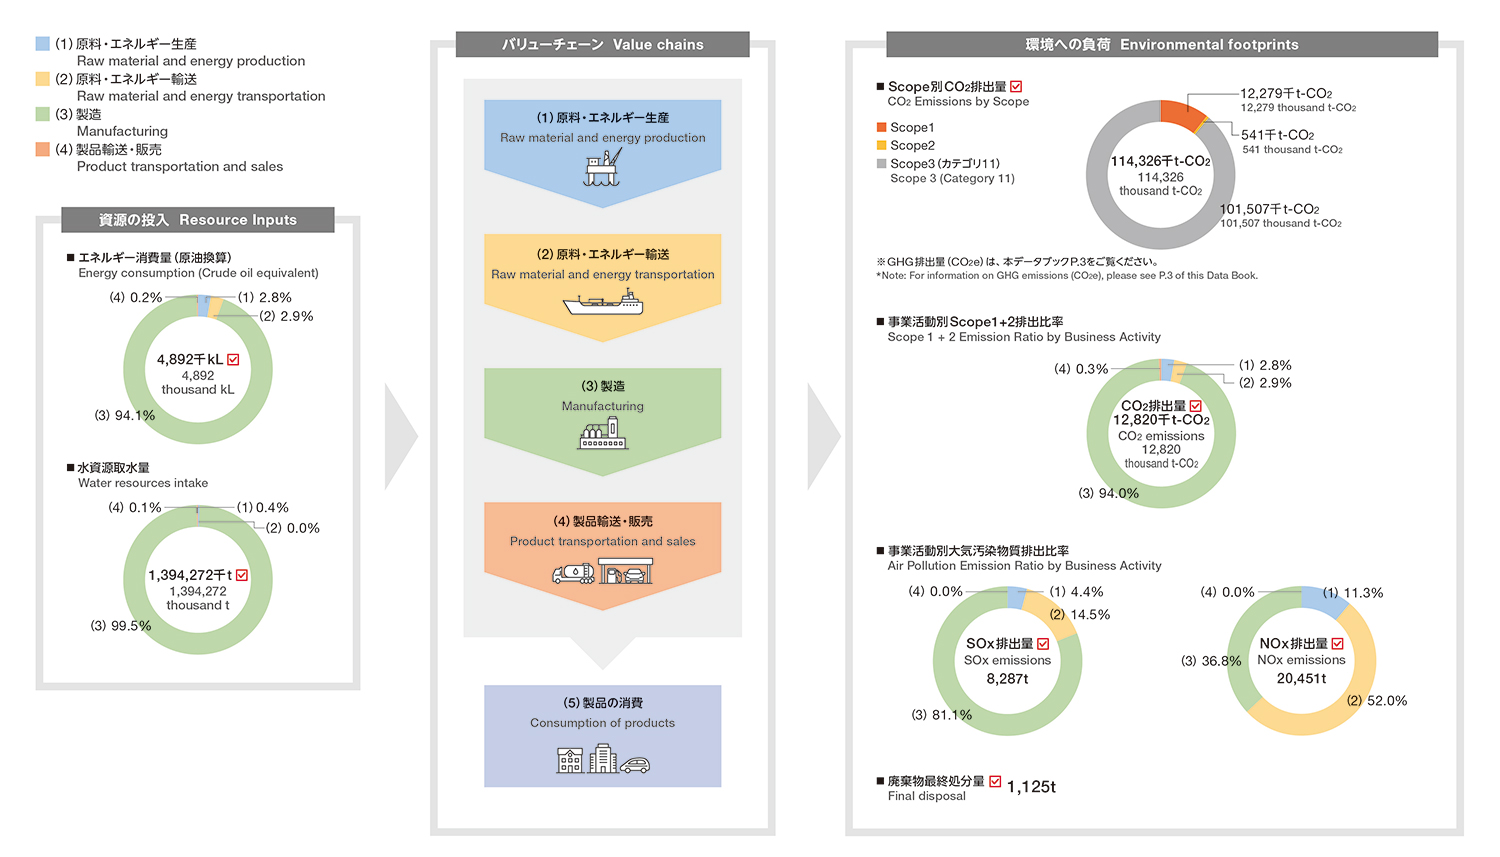
*Ratio data may not add up to the total due to rounding.
*Ratio data may not add up to the total due to rounding.
*Ratio data may not add up to the total due to rounding.
●CO₂ emissions (Scope1, 2, 3)
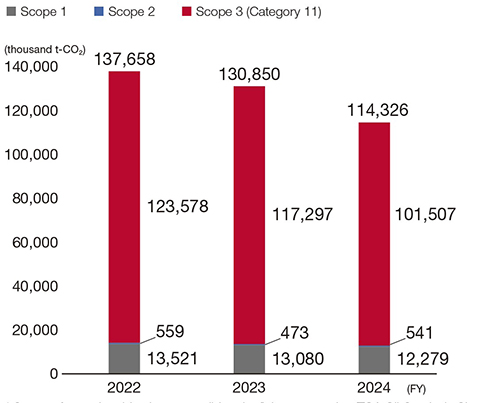
* Scope of calculation: Idemitsu Kosan, consolidated refining companies (TOA Oil Co., Showa Yokkaichi Sekiyu Co., Seibu Oil Co.) and major consolidated companies
* Scope of calculation: Idemitsu Kosan, consolidated refining companies (TOA Oil Co., Showa Yokkaichi Sekiyu Co., Seibu Oil Co.) and major consolidated companies
* Scope of calculation: Idemitsu Kosan, consolidated refining companies (TOA Oil Co., Showa Yokkaichi Sekiyu Co., Seibu Oil Co.) and major consolidated companies
●CO₂ emissions (Scope1+2)
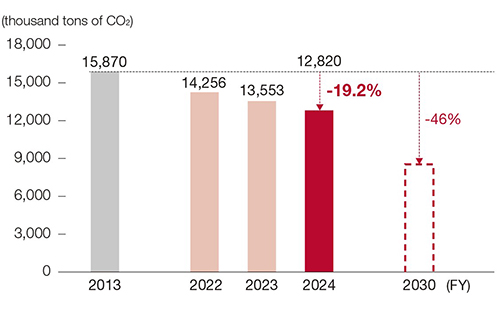
* Scope of data: Idemitsu Kosan, consolidated refining companies (TOA Oil Co., Showa Yokkaichi Sekiyu Co., Seibu Oil Co.) and major consolidated companies
* Scope of data: Idemitsu Kosan, consolidated refining companies (TOA Oil Co., Showa Yokkaichi Sekiyu Co., Seibu Oil Co.) and major consolidated companies
* Scope of data: Idemitsu Kosan, consolidated refining companies (TOA Oil Co., Showa Yokkaichi Sekiyu Co., Seibu Oil Co.) and major consolidated companies
●Breakdown of waste disposal in FY2023
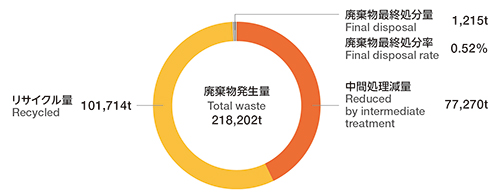
* The amount of waste generated includes the amount disposed of within the company, so it does not match the total amount of each disposal amount shown in the figure.
*Waste is the total of industrial waste and specially controlled industrial waste.
[Data collection targets] Hokkaido Refinery, Chiba Complex, Aichi Complex, Tokuyama Complex, TOA Oil Co., Showa Yokkaichi Sekiyu Co., Seibu Oil Co.
●Final disposal rate at group refineries
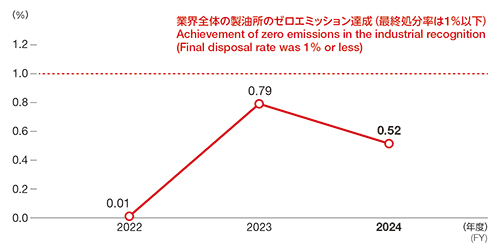
*Waste is the total of industrial waste and specially controlled industrial waste.
[Data collection targets] Hokkaido Refinery, Chiba Complex, Aichi Complex, Tokuyama Complex, TOA Oil Co., Showa Yokkaichi Sekiyu Co., Seibu Oil Co.
*Waste is the total of industrial waste and specially controlled industrial waste.
[Data collection targets] Hokkaido Refinery, Chiba Complex, Aichi Complex, Tokuyama Complex, TOA Oil Co., Showa Yokkaichi Sekiyu Co., Seibu Oil Co.
*Waste is the total of industrial waste and specially controlled industrial waste.
[Data collection targets] Hokkaido Refinery, Chiba Complex, Aichi Complex, Tokuyama Complex, TOA Oil Co., Showa Yokkaichi Sekiyu Co., Seibu Oil Co.
●Idemitsu Engagement Index
*Scope of reporting: Idemitsu employees (excludes employees seconded to other companies)
*Scope of reporting: Idemitsu employees (excludes employees seconded to other companies)
*Scope of reporting: Idemitsu employees (excludes employees seconded to other companies)
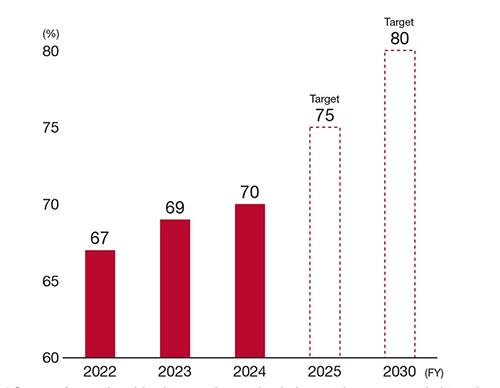
●Female ratio in managerial positions
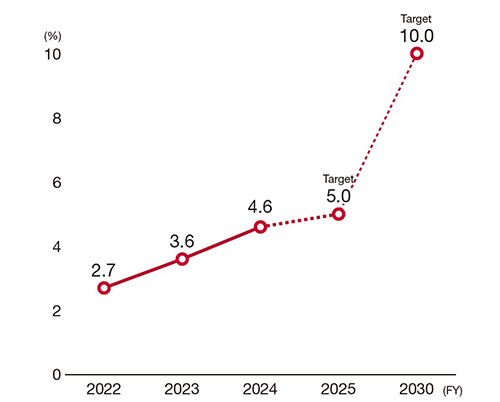
*Data includes Idemitsu Kosan employees (full-time employees, senior employees, full-time contract employees, and advisors) and employees seconded to other companies.
*Data includes Idemitsu Kosan employees (full-time employees, senior employees, full-time contract employees, and advisors) and employees seconded to other companies.
*Data includes Idemitsu Kosan employees (full-time employees, senior employees, full-time contract employees, and advisors) and employees seconded to other companies.
●Female recruiting ratio
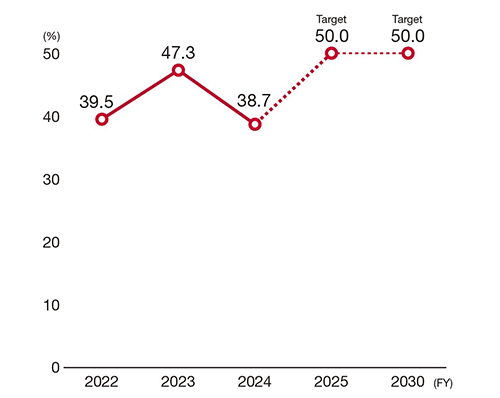
*Scope of reporting: Idemitsu’s direct hires college graduates or higher (Recruitment of new graduates, and Career) between April 1 and March 31
*Scope of reporting: Idemitsu’s direct hires college graduates or higher (Recruitment of new graduates, and Career) between April 1 and March 31
*Scope of reporting: Idemitsu’s direct hires college graduates or higher (Recruitment of new graduates, and Career) between April 1 and March 31
●Male ratio taking childcare leave
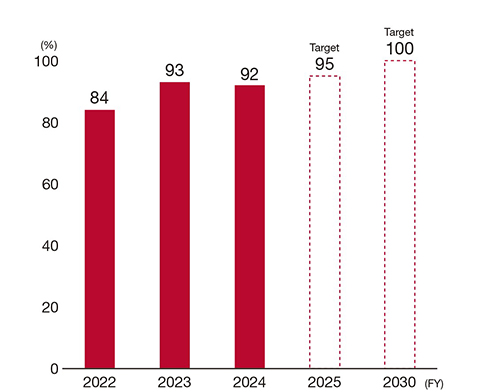
* Data collected: Idemitsu Kosan employment (all employees, including those seconded to other companies) as of March 31st
*The above includes childcare leave.
* Data collected: Idemitsu Kosan employment (all employees, including those seconded to other companies) as of March 31st
*The above includes childcare leave.
* Data collected: Idemitsu Kosan employment (all employees, including those seconded to other companies) as of March 31st
*The above includes childcare leave.
●Investments in training per employee
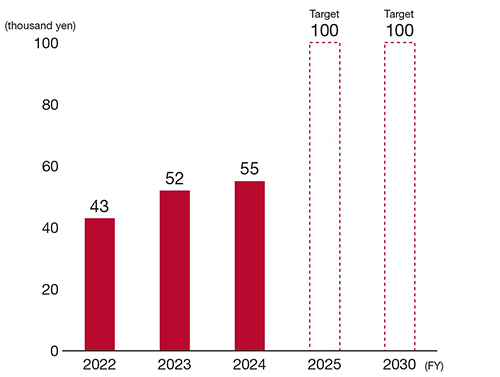
* Data collected: Idemitsu Kosan employment (all employees, including those seconded to other companies) as of March 31st
*The above includes childcare leave.
* Data collected: Idemitsu Kosan employment (all employees, including those seconded to other companies) as of March 31st
*The above includes childcare leave.
* Data collected: Idemitsu Kosan employment (all employees, including those seconded to other companies) as of March 31st
*The above includes childcare leave.
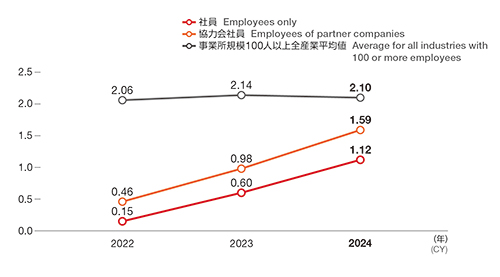
●Occupational accidents frequency rate (accident incidence frequency)
●Severity rate (degree of accident severity)
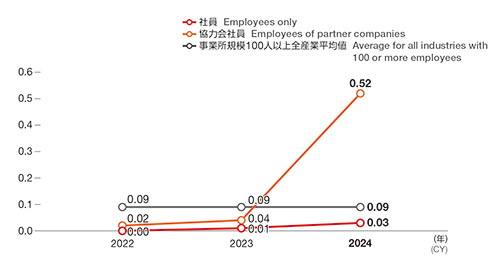
* Data collected from: Hokkaido Refinery, Chiba Complex (Prime Polymer Co., Ltd. Anesaki Plant), Aichi Complex, Tokuyama Complex, TOA Oil Co. Keihin Refinery, TOA Oil Co.
Mizue Power Plant, Showa Yokkaichi Sekiyu Co. Yokkaichi Refinery, Seibu Oil Co. Yamaguchi Refinery (Until 2021, BASF Idemitsu Co., Ltd. was included in Chiba Complex)
Employees: Employees of Idemitsu Kosan Co., Ltd., TOA Oil Co., Showa Yokkaichi Sekiyu Co., Seibu Oil Co., and Prime Polymer Co., Ltd. who work at the bases covered by the above calculations.
Cooperative company staff: Idemitsu Plantec Hokkaido Co., Ltd., Idemitsu Plantec Chiba Co., Ltd., Idemitsu Plantec Aichi Co., Ltd., Idemitsu Plantec Tokuyama Co., Ltd.
Employees and employees of partner companies to which the above-mentioned bases subject to the data collection outsource their work
[Data collection period] January to December
*The average value for all Complex for establishments with 100 or more employees is taken from the Ministry of Health, Labor and Welfare's "2023 Work Accident Trends Survey."
● Composition of Board of Directors and Audit & Supervisory Board
●Number of patent applications (published applications)
●Number of registered patents held
●Value of patents held and percentage of patents with high value (company-wide)
.jpg)
●Value of patents held (OLED, Lithium battery materials businesses)
.jpg)
Independent Assurance Report
Independent Assurance Report